Web Interface
The Adamo web app at operate.adamohq.com is where you view video streams, control robots, and manage your fleet.
Logging In
Section titled “Logging In”Go to operate.adamohq.com and sign in with Google. If you belong to multiple organizations, you’ll be prompted to select one.
Robot Grid
Section titled “Robot Grid”After logging in, you’ll see a grid of your robots. Each card shows a live video thumbnail, the robot name, and a status badge (LIVE or IDLE). A search bar filters robots by name.
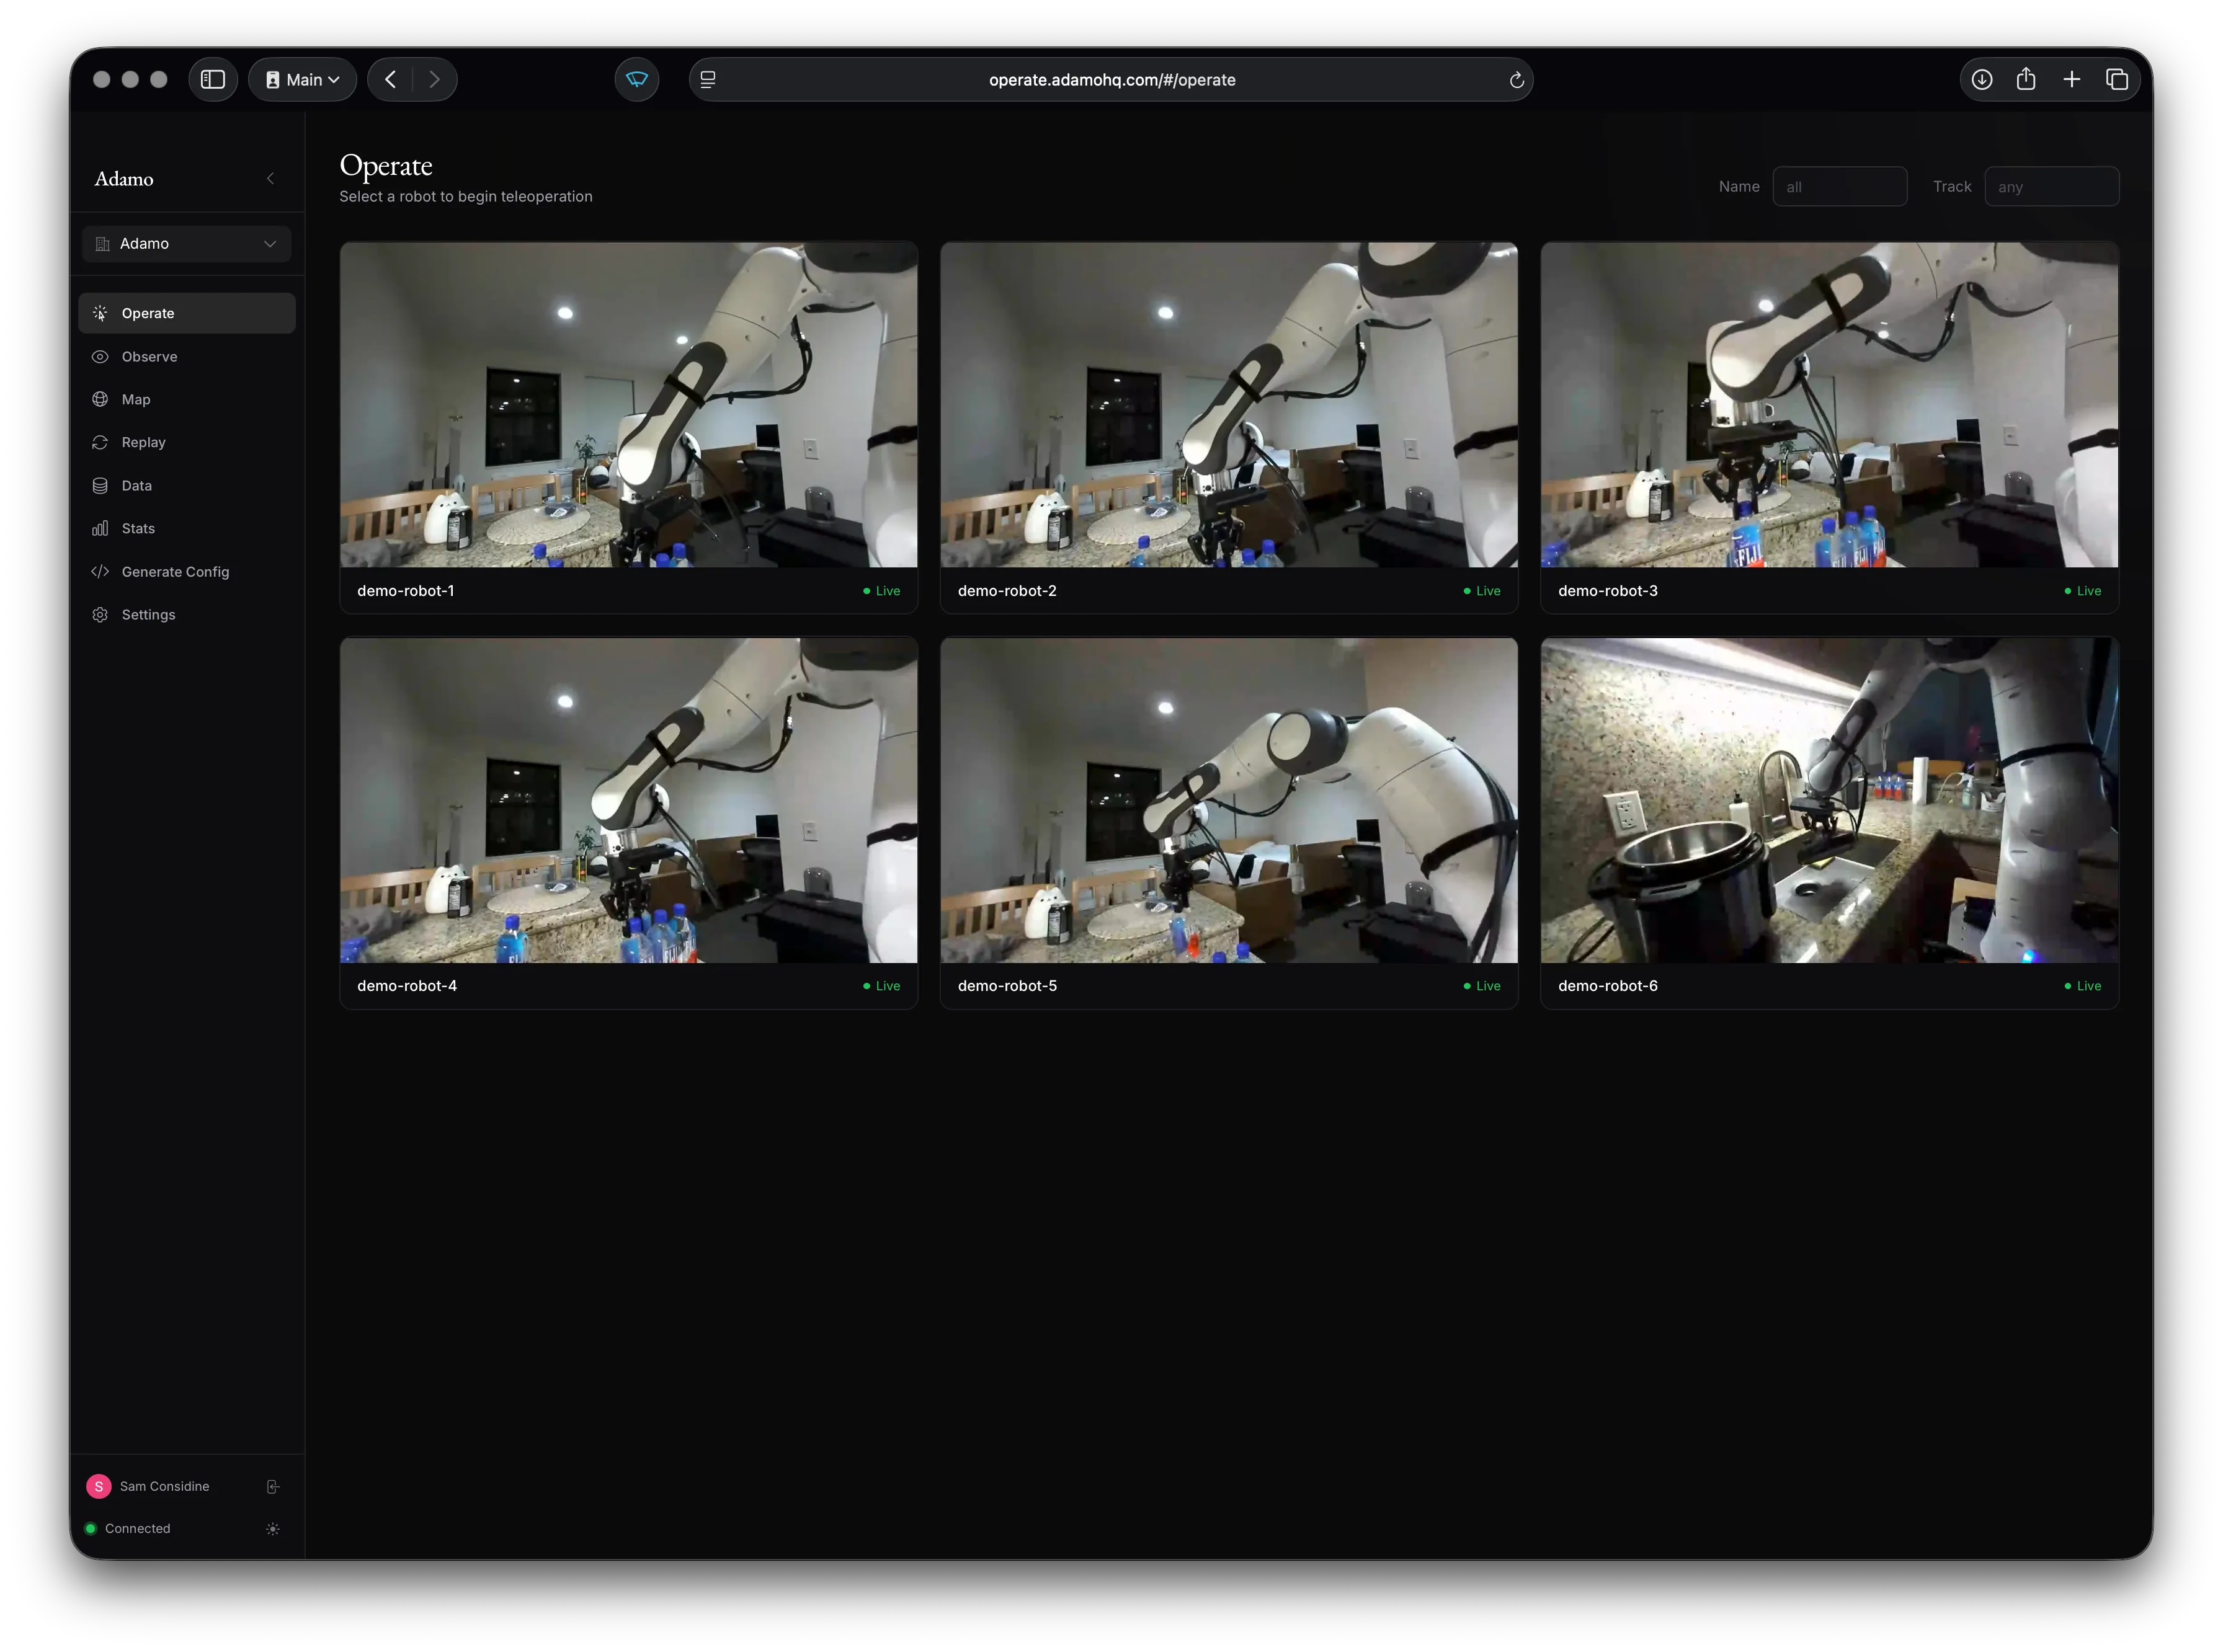
Click a robot to enter the teleoperation view.
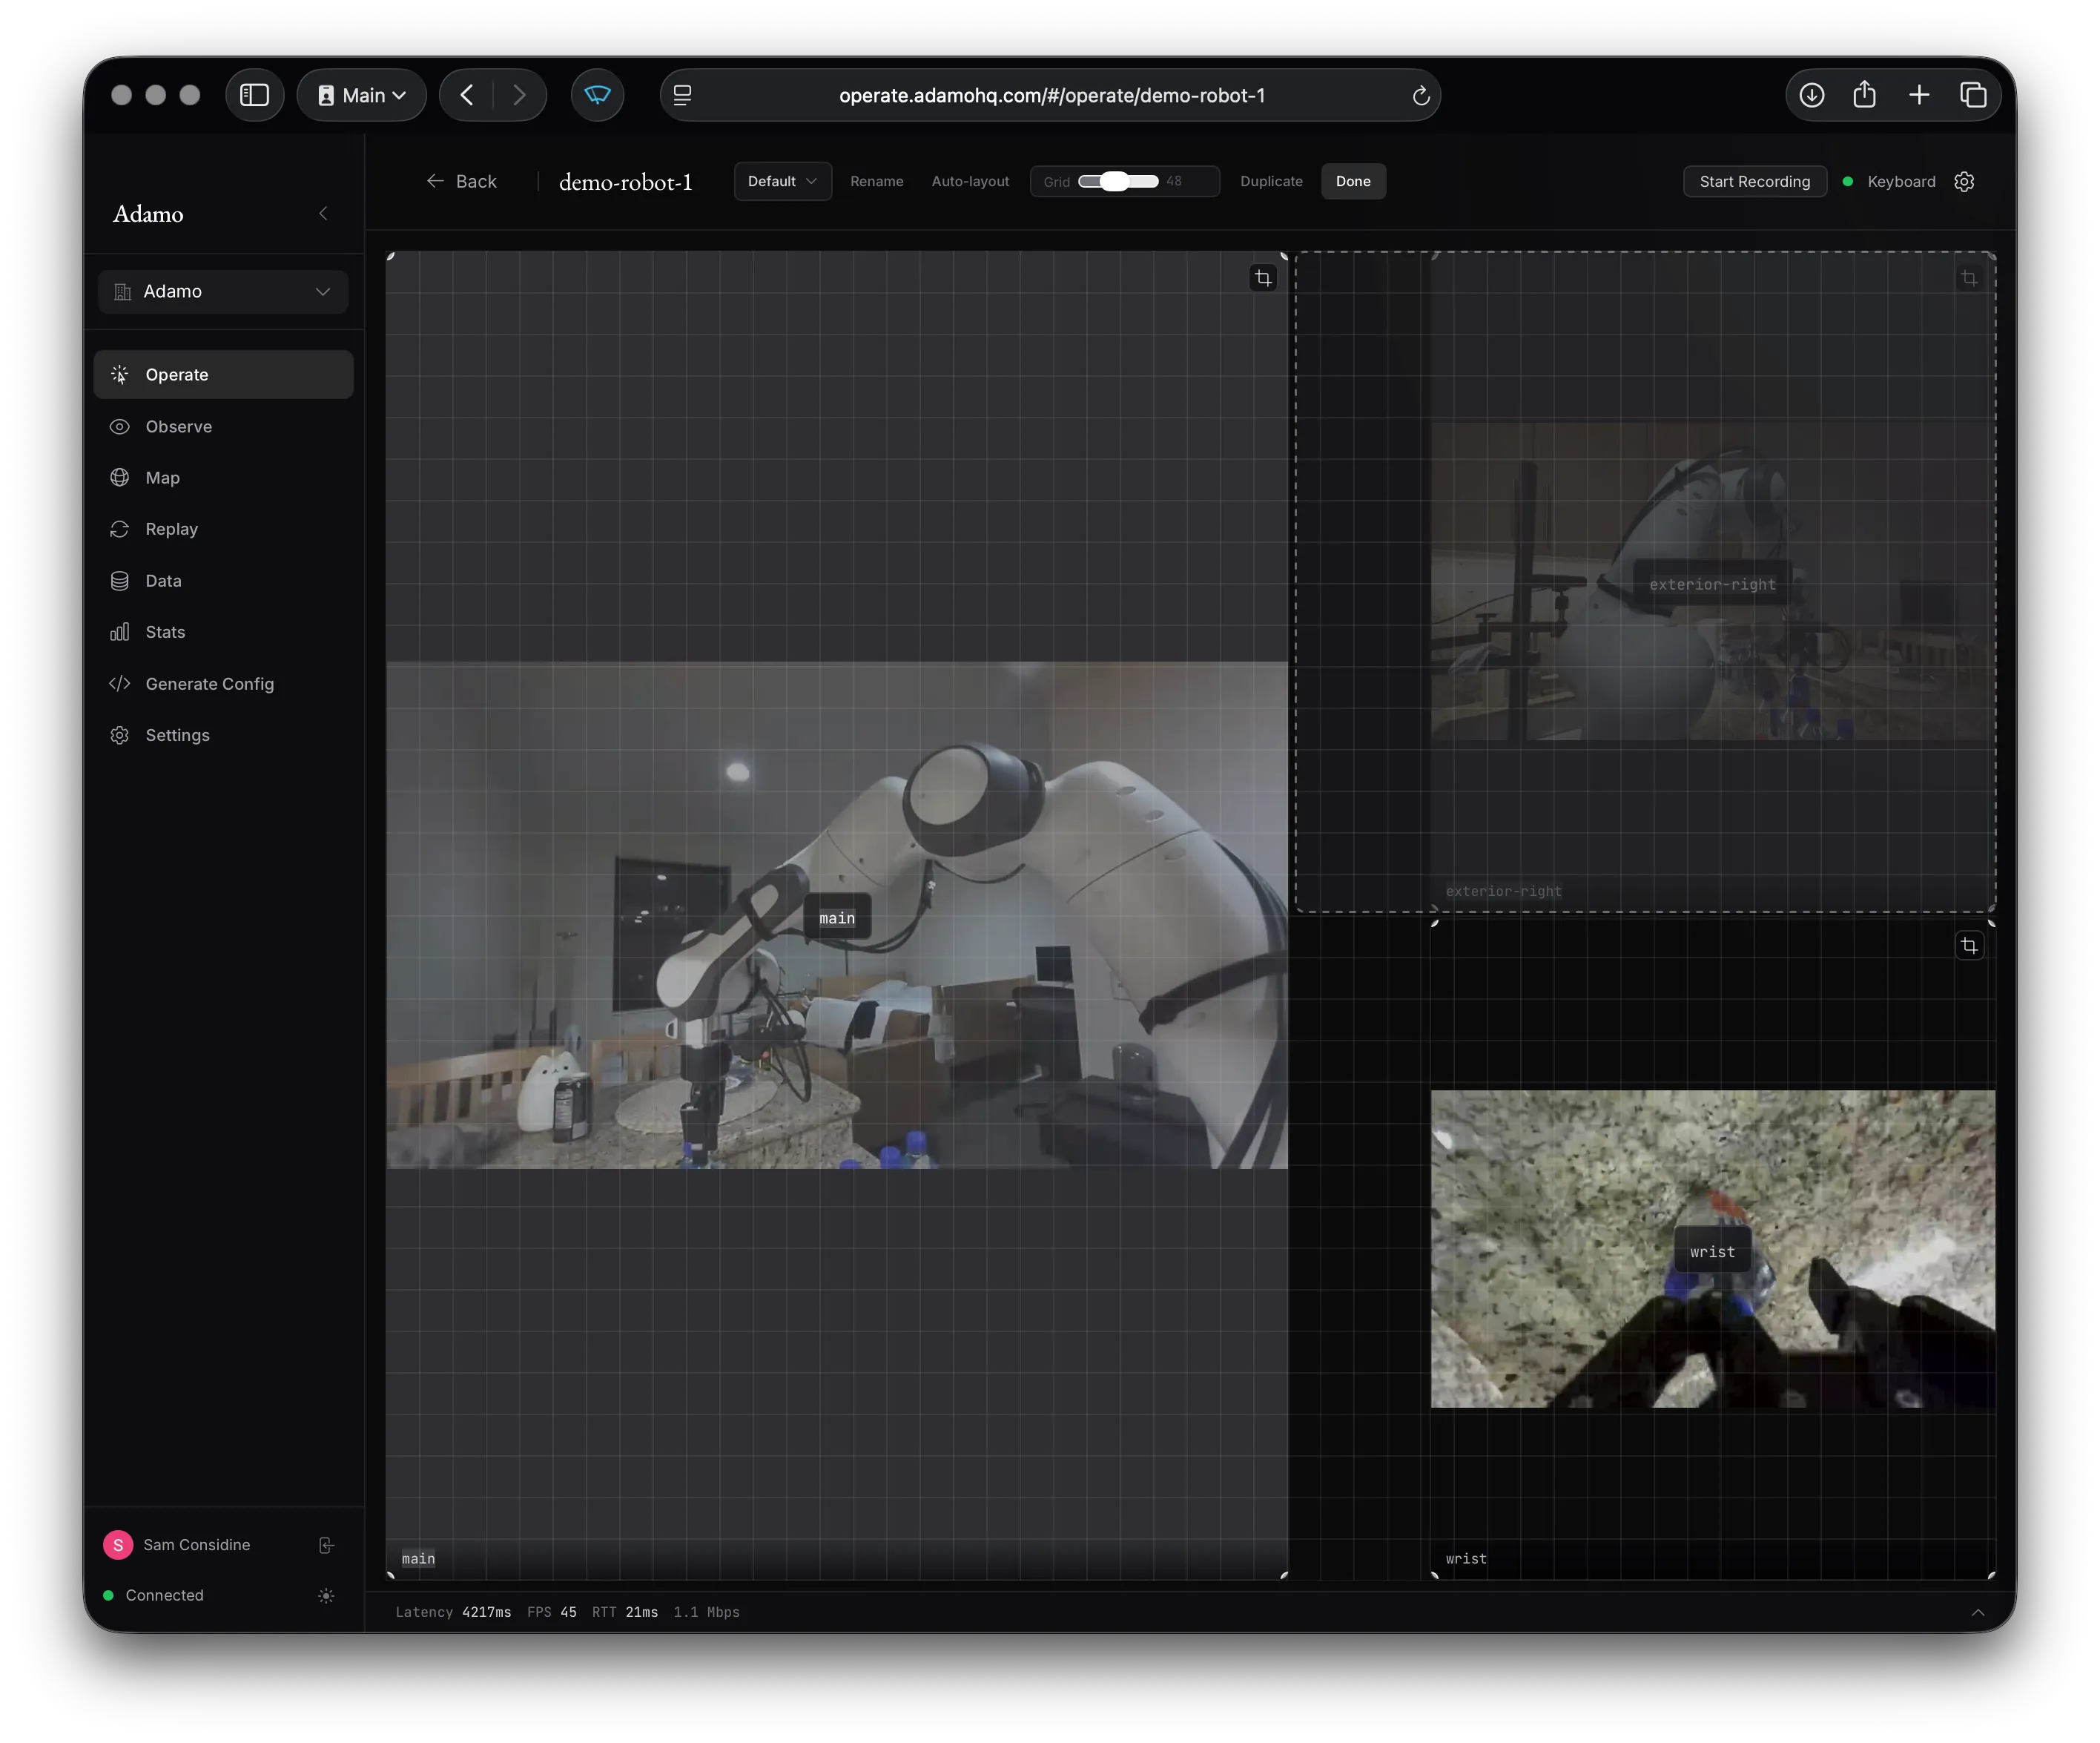
Teleoperation View
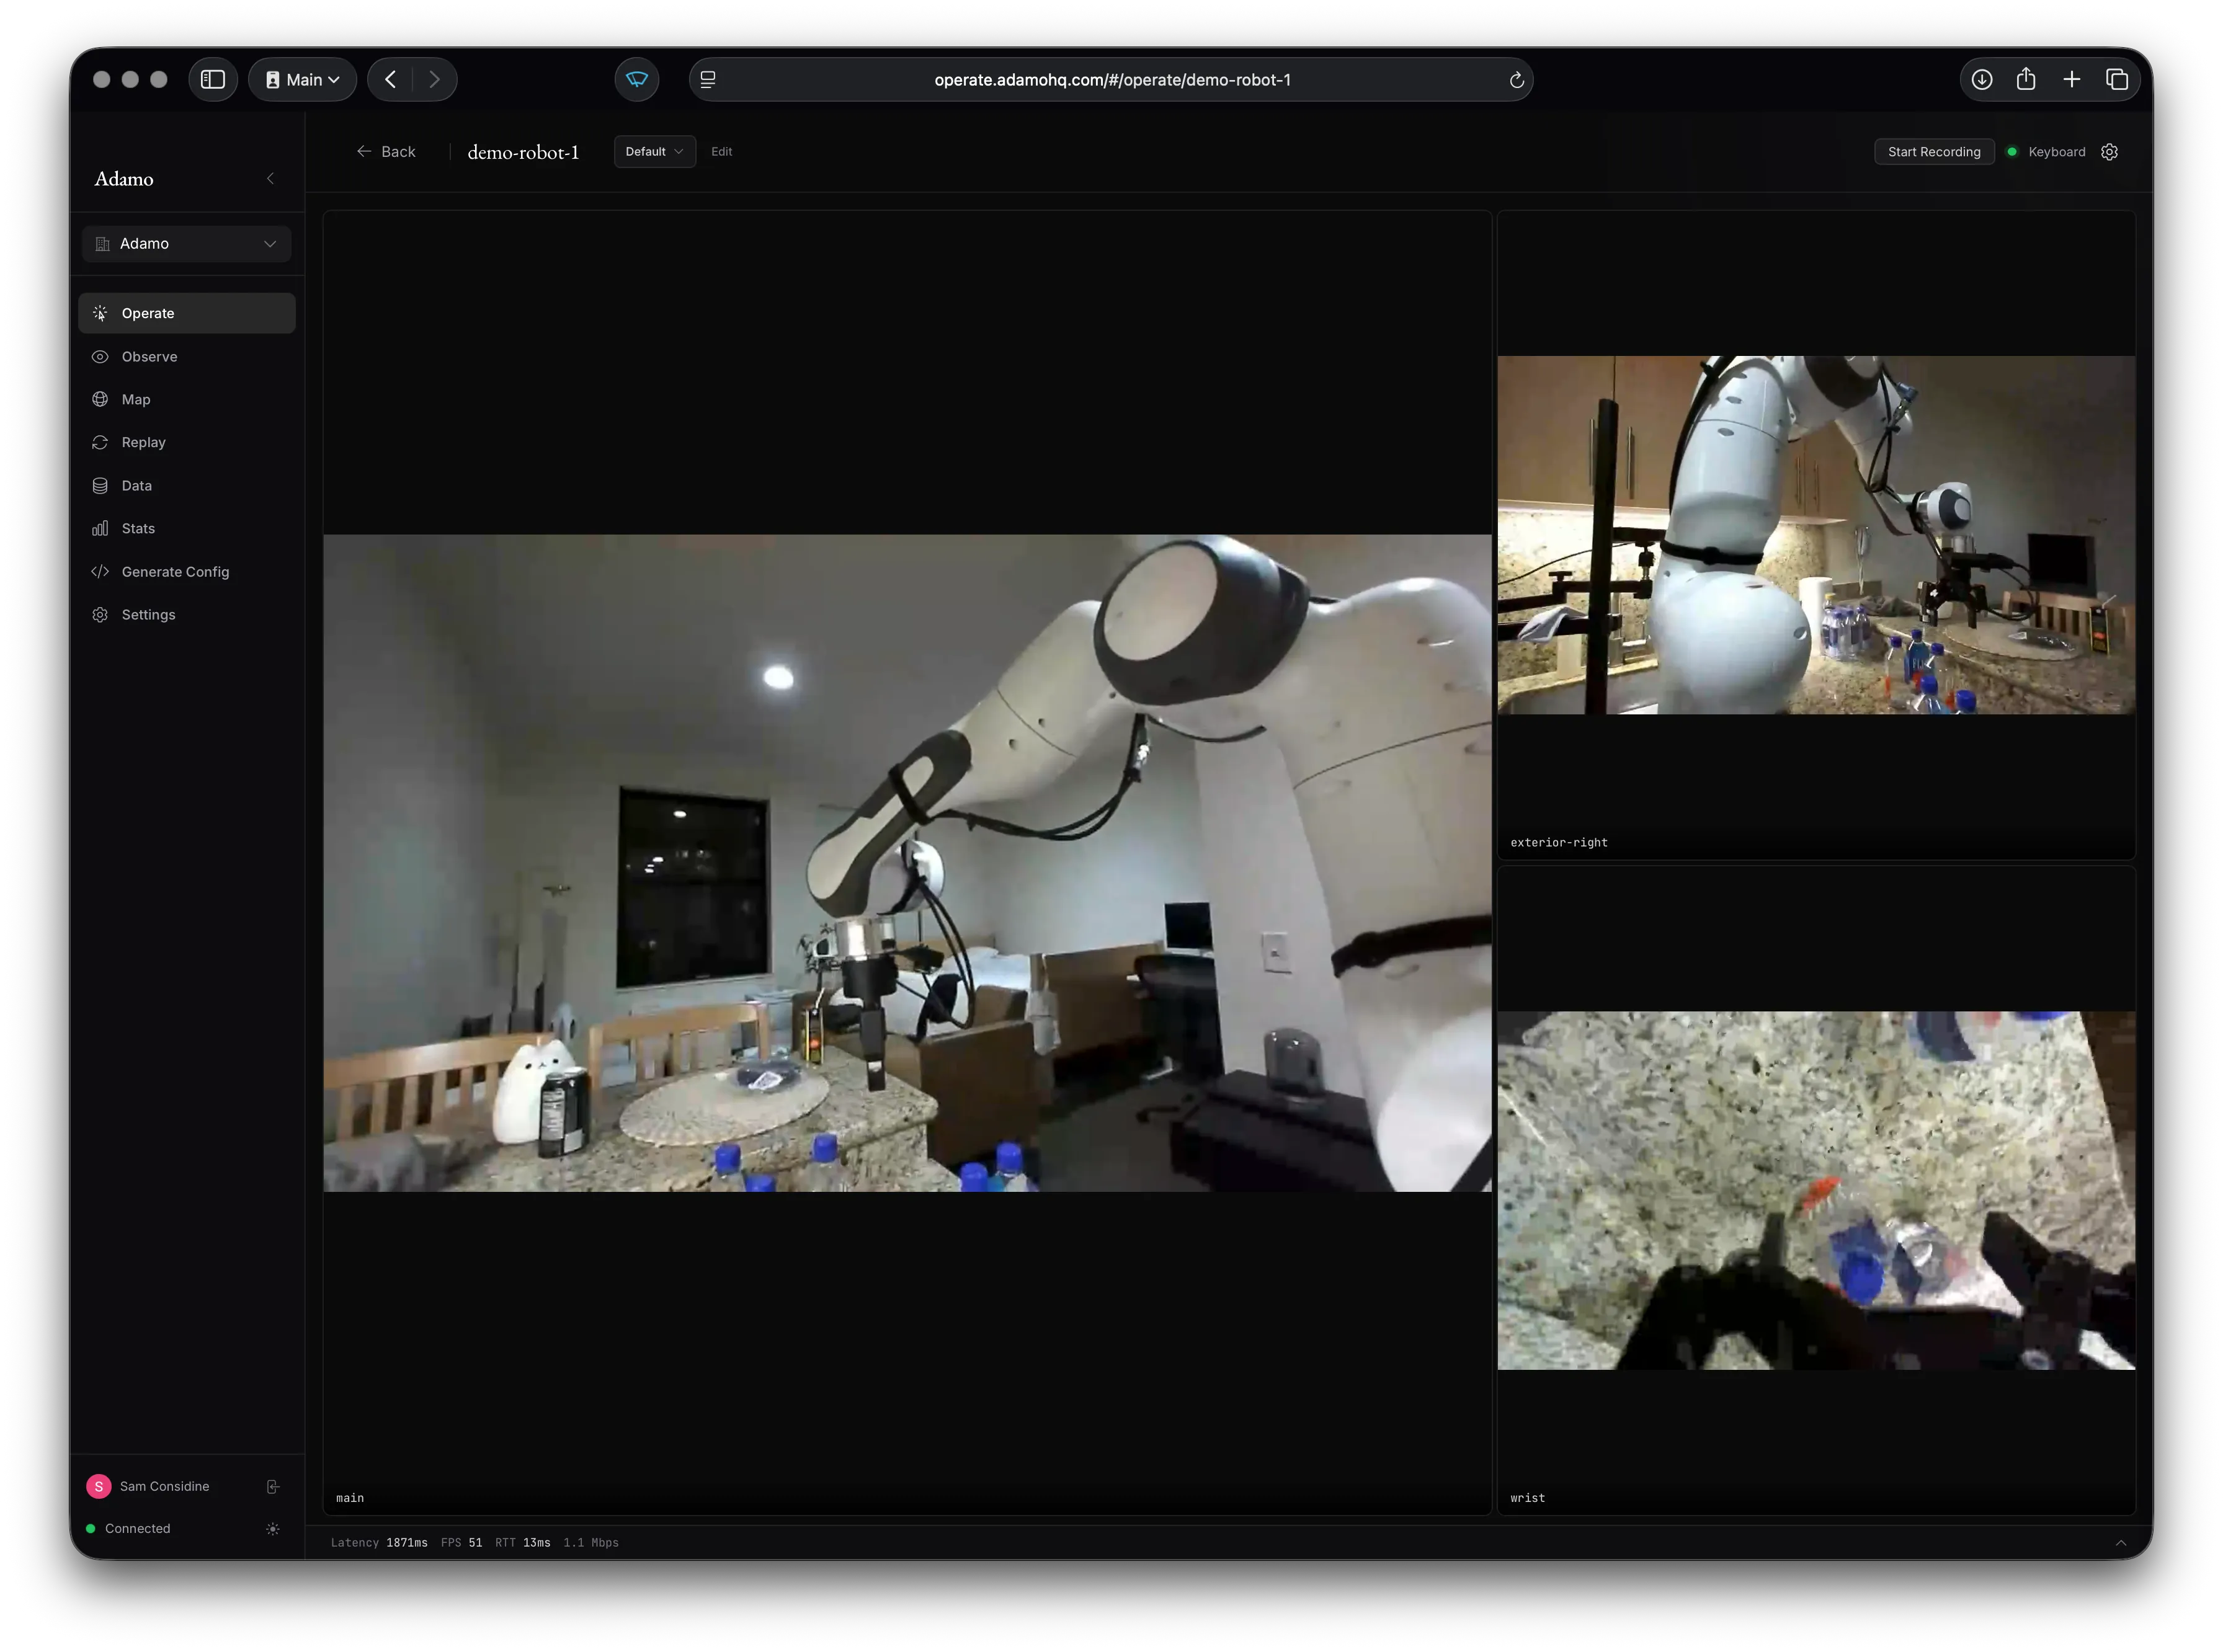
Section titled “Teleoperation View”This is where you operate a robot. The main area is a camera grid showing all active video streams.
Video Streams
Section titled “Video Streams”Video streams display in a configurable grid layout. If the robot has multiple tracks (e.g., “front”, “rear”, “depth”), they all appear simultaneously. Lidar tracks render as interactive 3D point clouds instead of video.
Stereo / VR
Section titled “Stereo / VR”Stereo video tracks have a “View Stereo” button that launches an immersive WebXR VR view. Head pose and VR controller positions are tracked and forwarded to the robot as control topics (see Control).
Control Panel
Section titled “Control Panel”A collapsible panel at the bottom shows stream stats (latency, FPS, RTT, bitrate) and input method status. Hover the bar-chart icon for the full latency breakdown. Expand the panel for the live robot log stream (lines published via robot.log(...) in the SDKs) and to switch between input methods (Gamepad or GELLO).
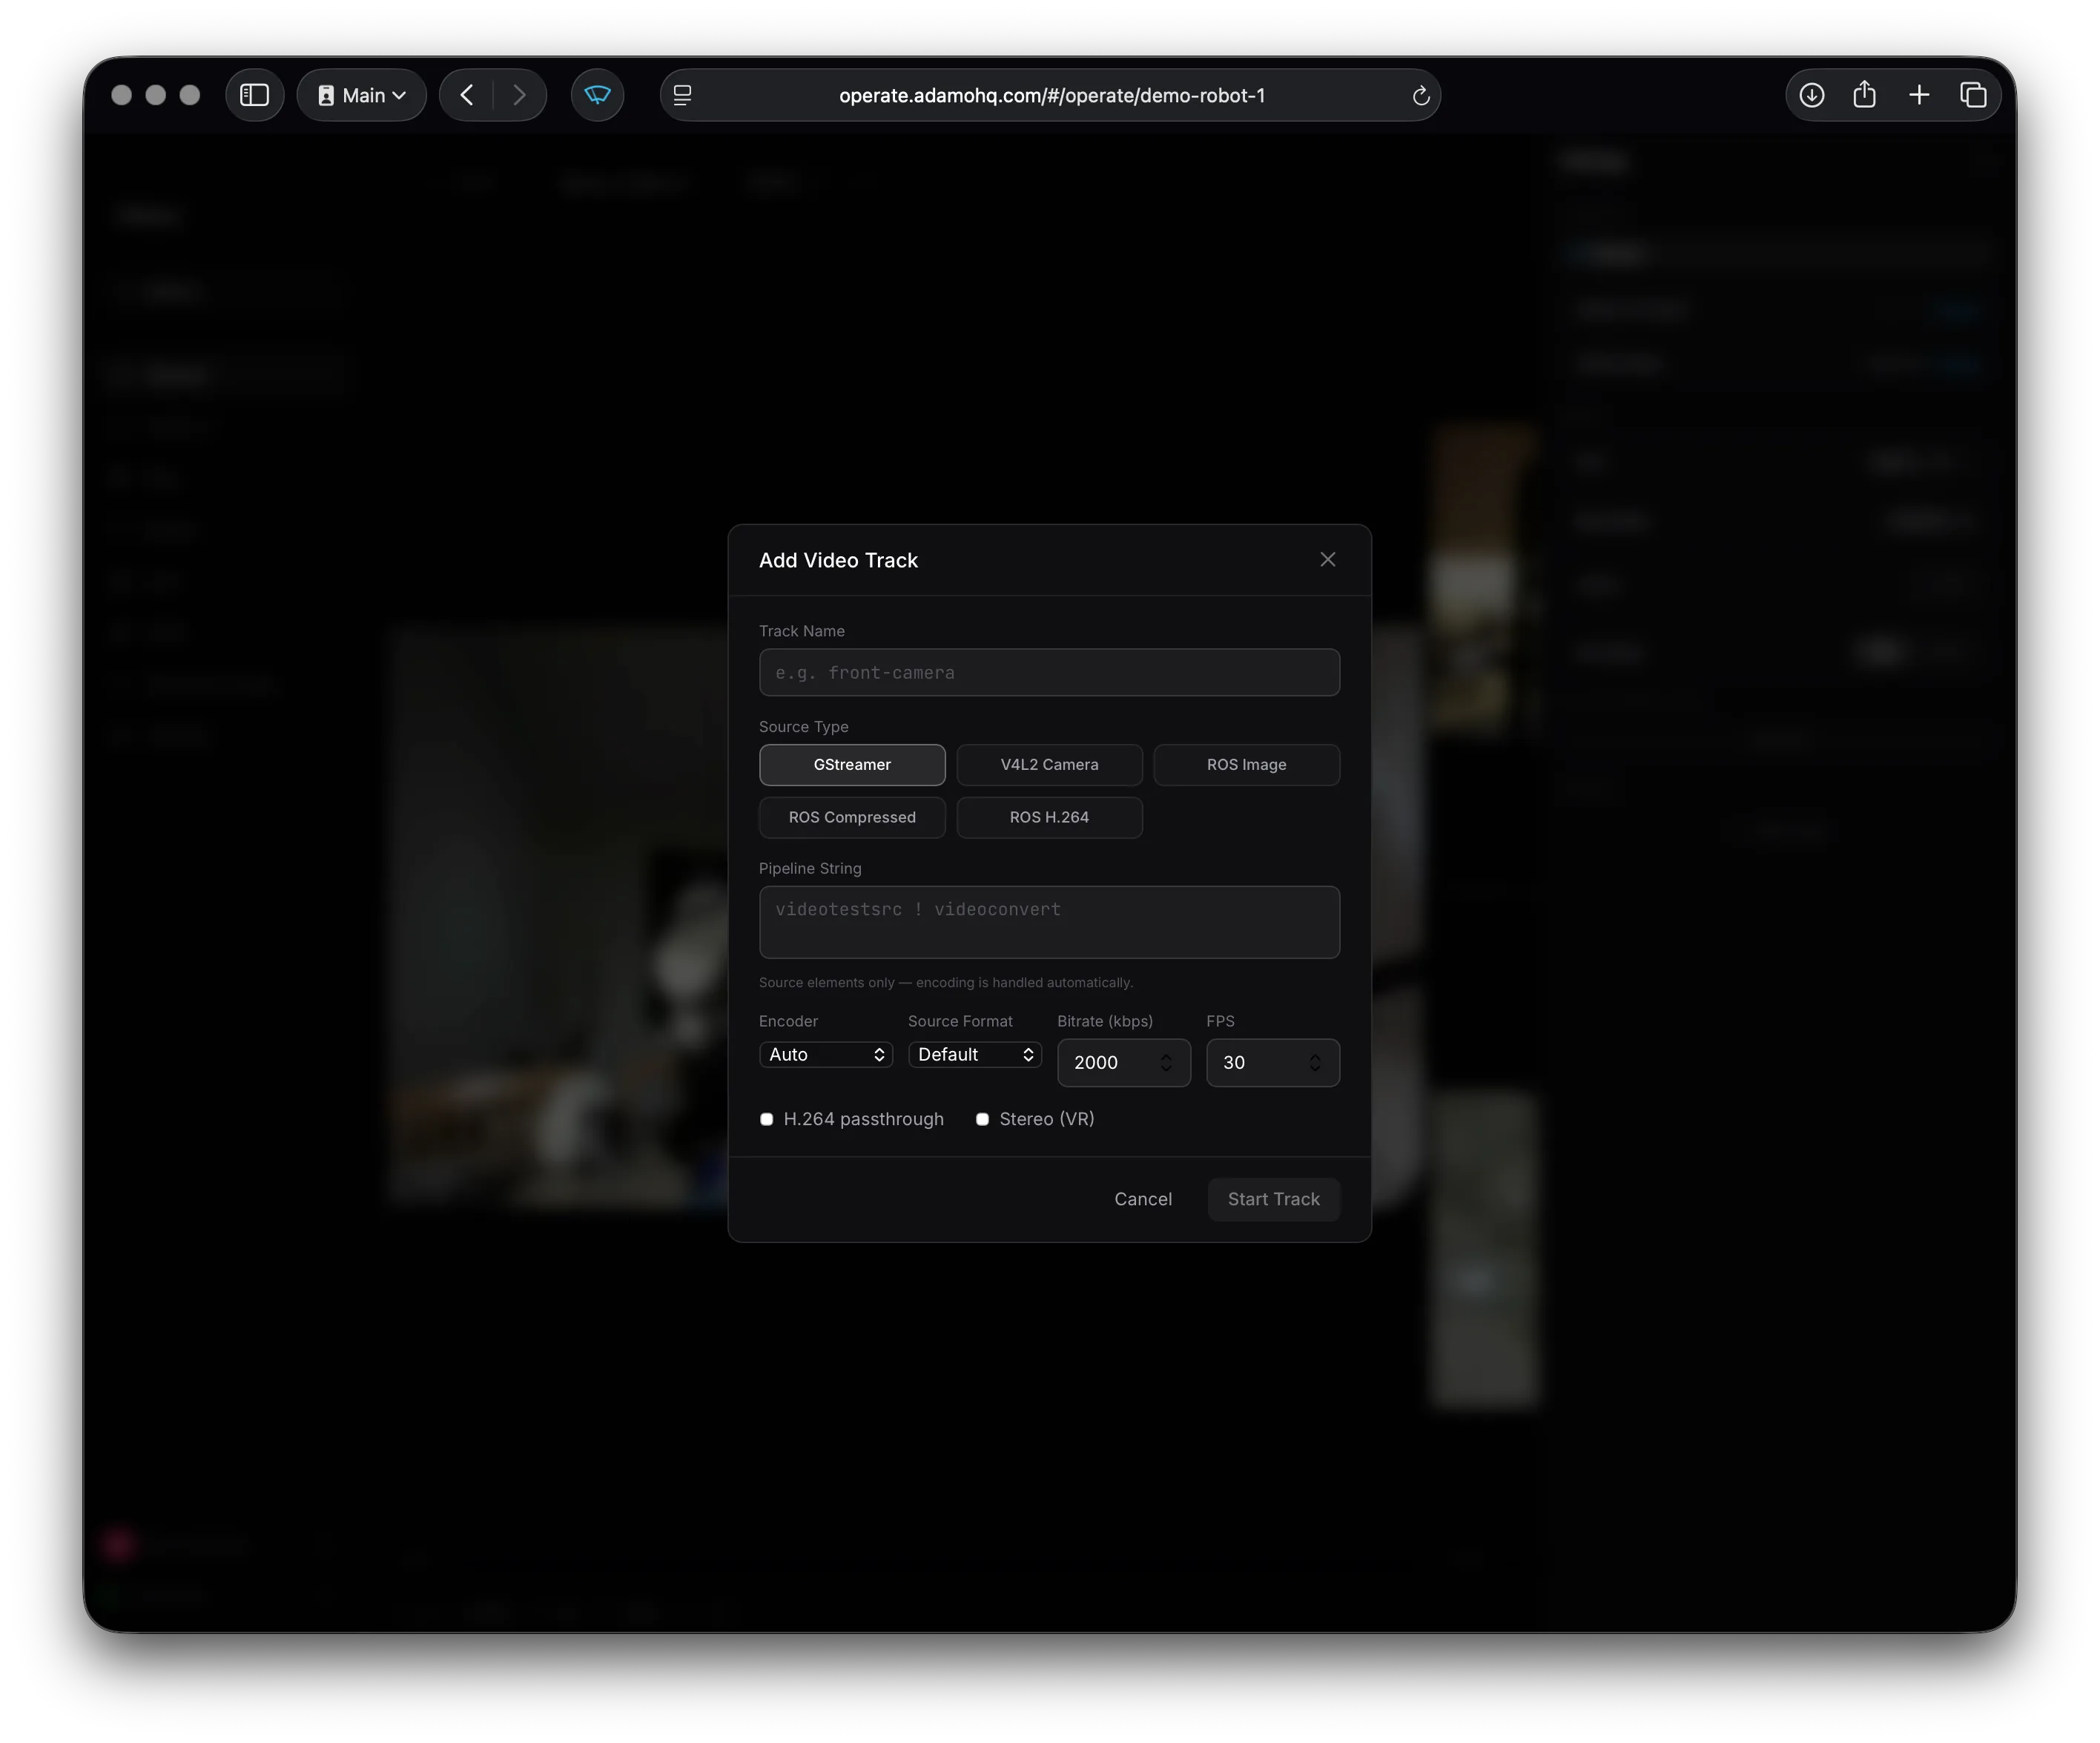
Adding Tracks
Section titled “Adding Tracks”Click “Add Track” to dynamically start a new video track on the robot without editing the config file. You can configure the source type, encoder, bitrate, and FPS from the dialog.
Layouts
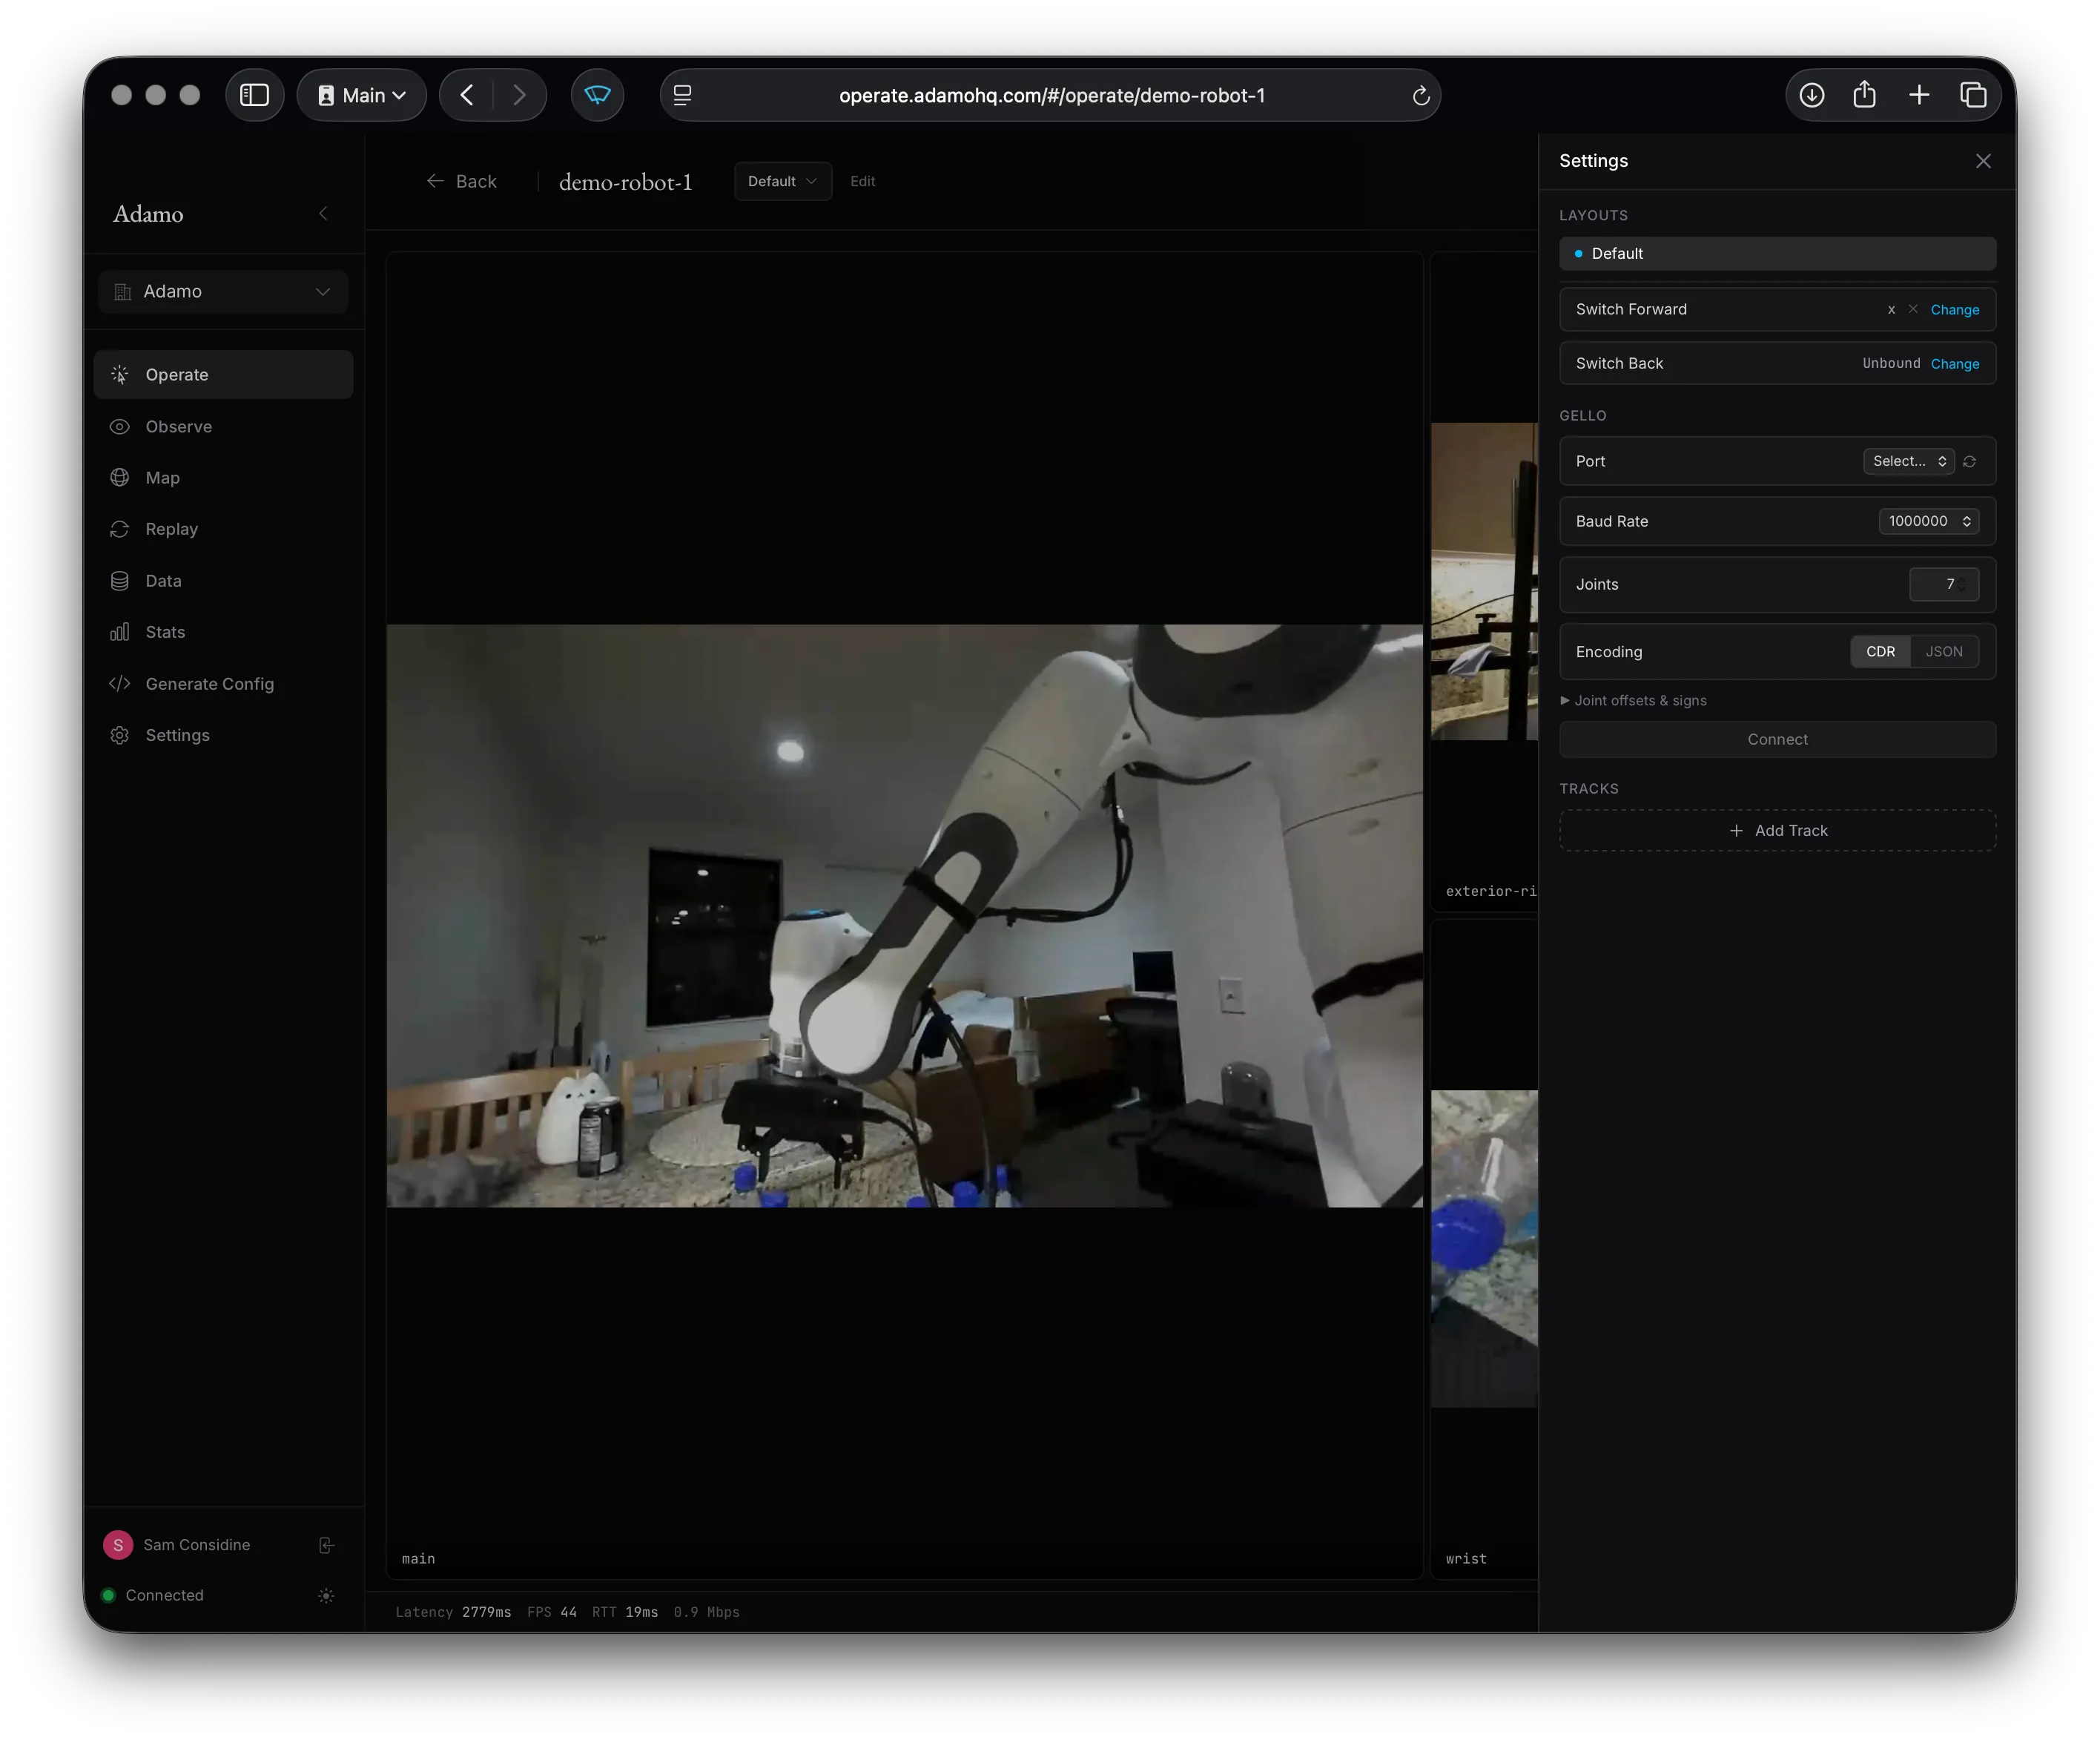
Section titled “Layouts”Layouts control how camera panels are arranged in the grid. You can create multiple layouts and switch between them.
Editing Layouts
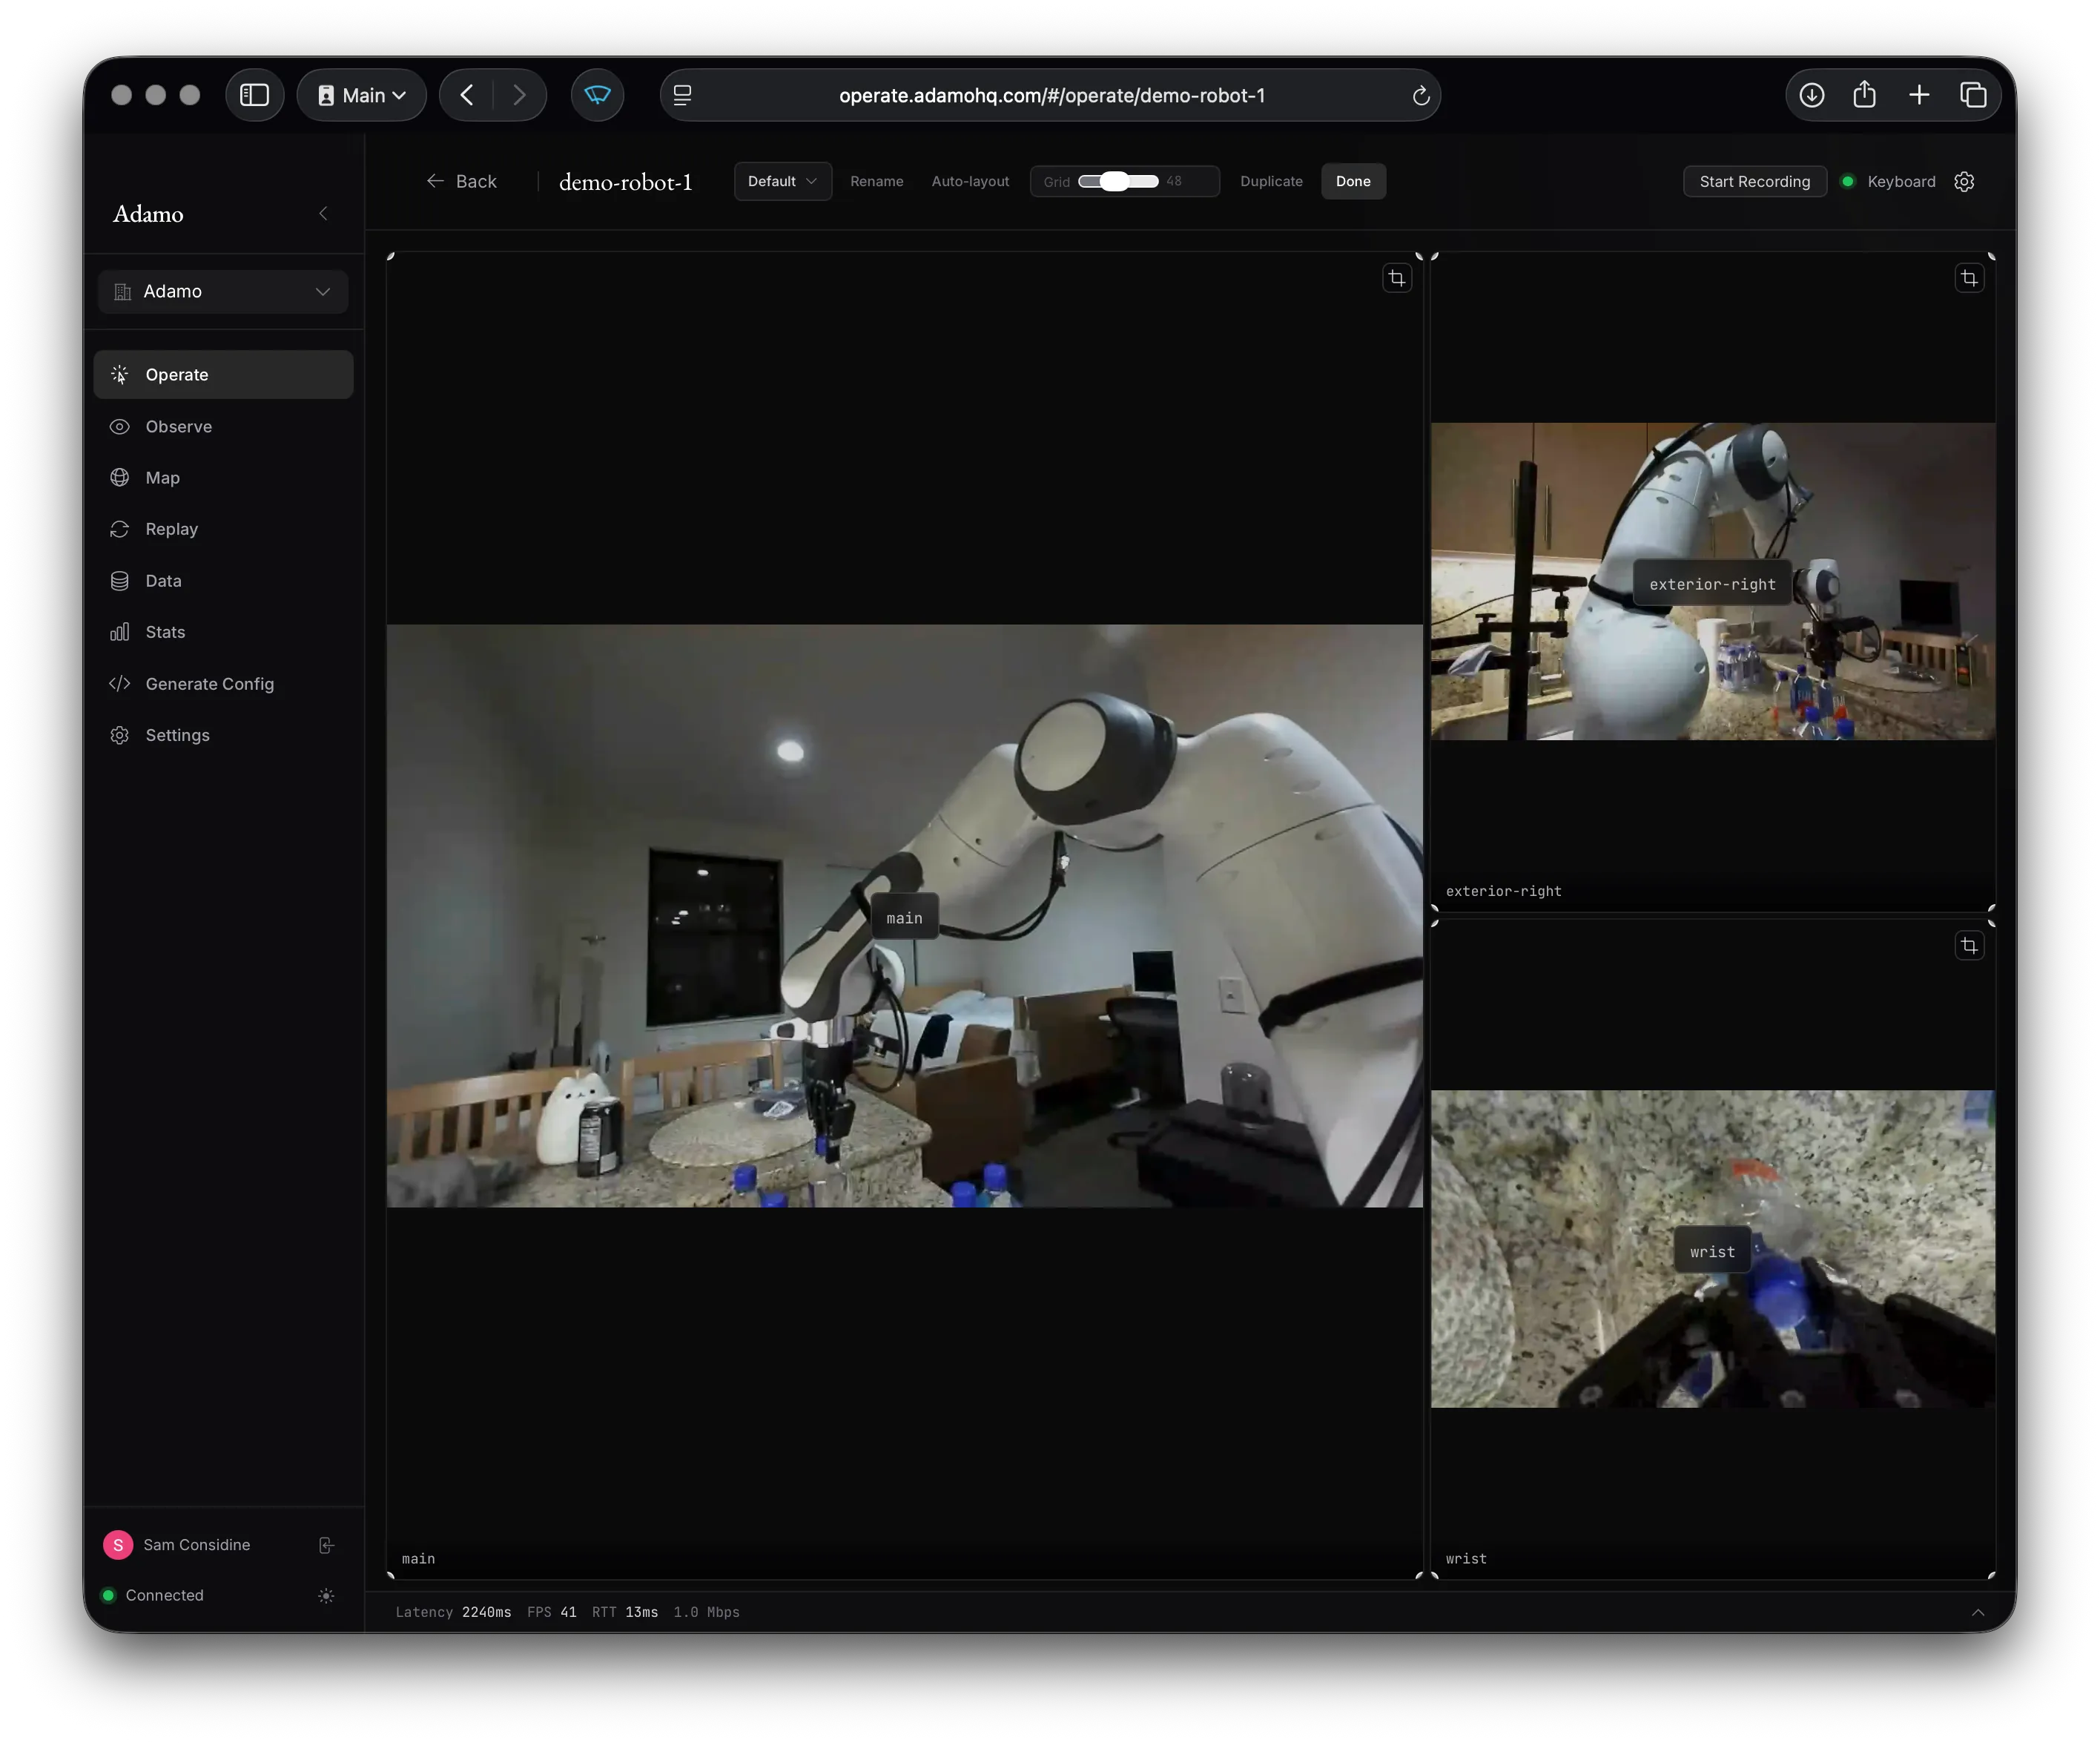
Section titled “Editing Layouts”Enter edit mode from the layout toolbar. In edit mode you can:
- Drag panels to reposition them on the grid
- Resize panels from corners and edges
- Crop panels to show a sub-region of the video
- Adjust grid fineness (12 to 96 columns) for precise placement
Unplaced cameras appear as buttons you can click to add them to the layout.
Switching Layouts
Section titled “Switching Layouts”Switch layouts from the toolbar dropdown, with a gamepad button binding, or with voice commands (“next layout”, “layout X”).
Observe Mode
Section titled “Observe Mode”Observe mode (/observe) shows the same camera grid and layouts but without any control capabilities. Use this for monitoring without the risk of sending accidental inputs.
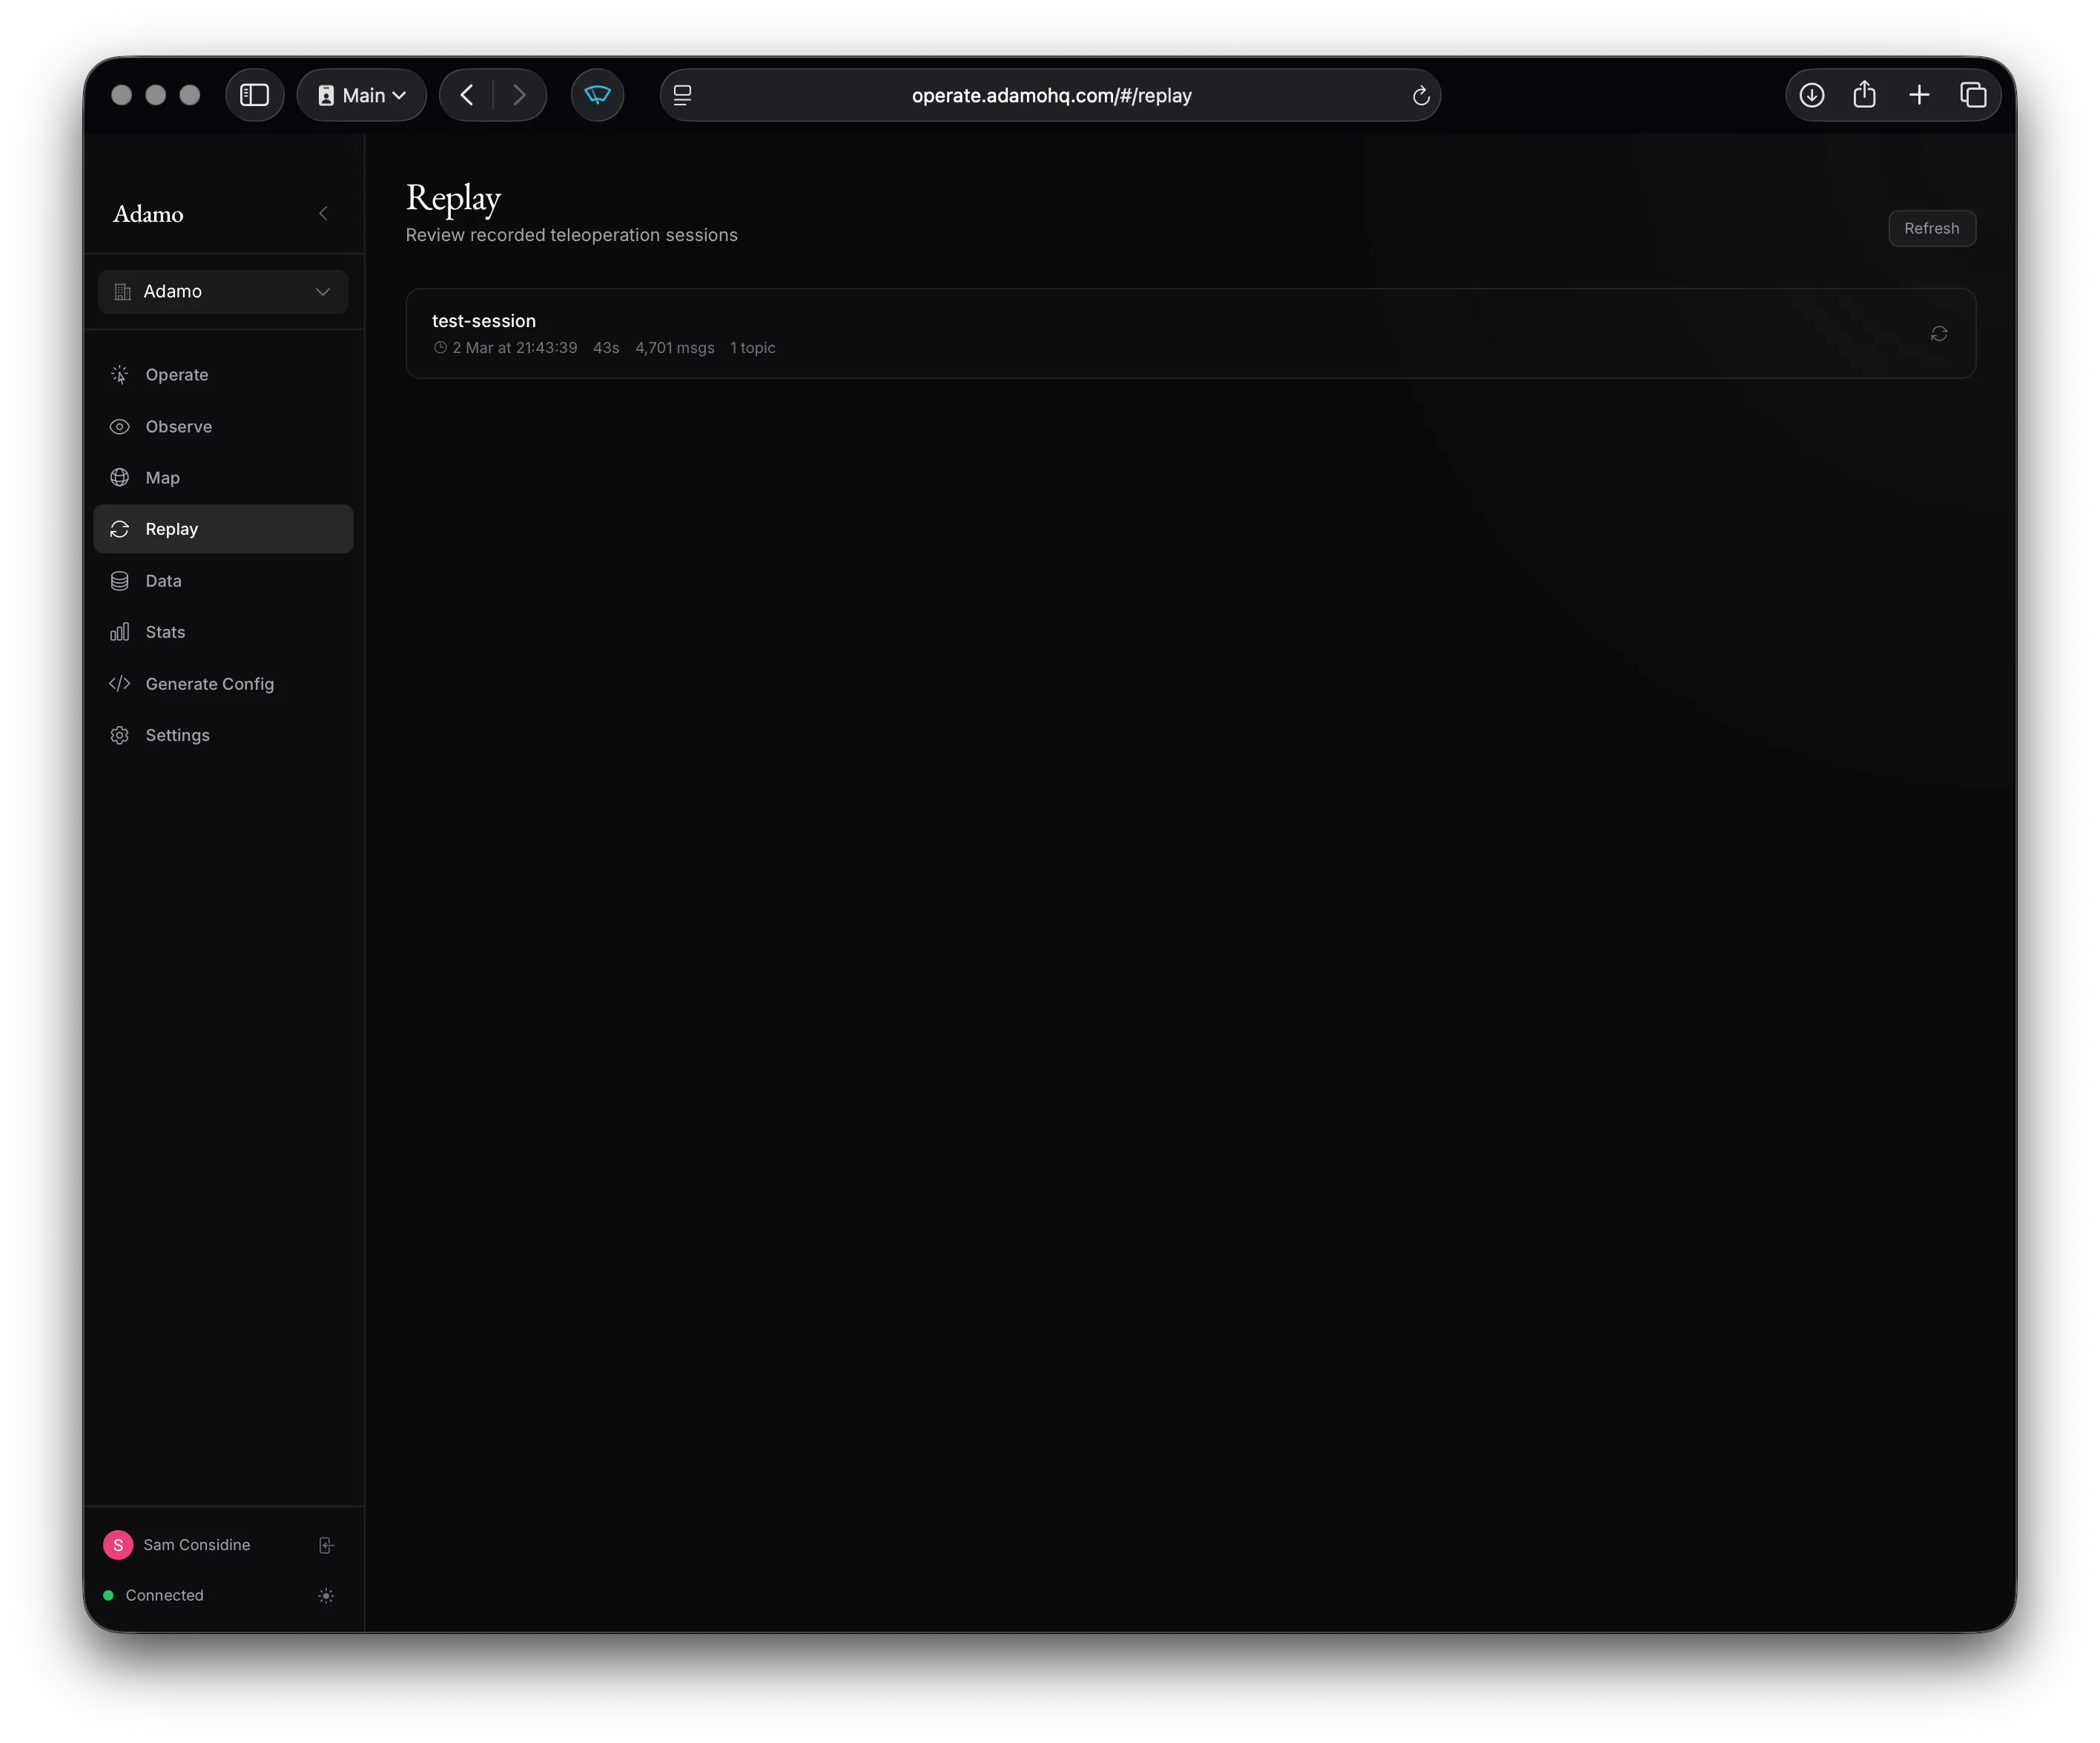
Recording & Replay
Section titled “Recording & Replay”Start a recording from the teleoperation view using the record button in the header. A red indicator and duration timer show that recording is active.
Recorded sessions appear on the Replay page (/replay) where you can play back video with transport controls (play, pause, seek) and a timeline scrubber.
Task List
Section titled “Task List”For labelling data collection, the teleoperation view can show a task list — named tasks you mark as you perform them. Enable it under Settings (⚙) → Tasks → “Show task list”; a panel then appears in the top-left.
- Sets and tasks — organize tasks into ordered sets. Add or remove them from the panel; the
⋯menu has New task / New set / Delete set. - Select a task — pick the one you’re about to do. The panel shows the active set and task.
- Start / stop — press the panel button, the
Rkey, or (in VR) the bound controller input (default: left stick down). While active the task is marked; in the headset a label is pinned to the top of your view. - Auto-progress (Settings → Tasks) — after each stop, automatically advance to the next task in the set, so you can capture a set in order with one button. On by default.
Each start/stop publishes a Zenoh signal your own code can consume — see Task Signals. These signals are independent of video recording.
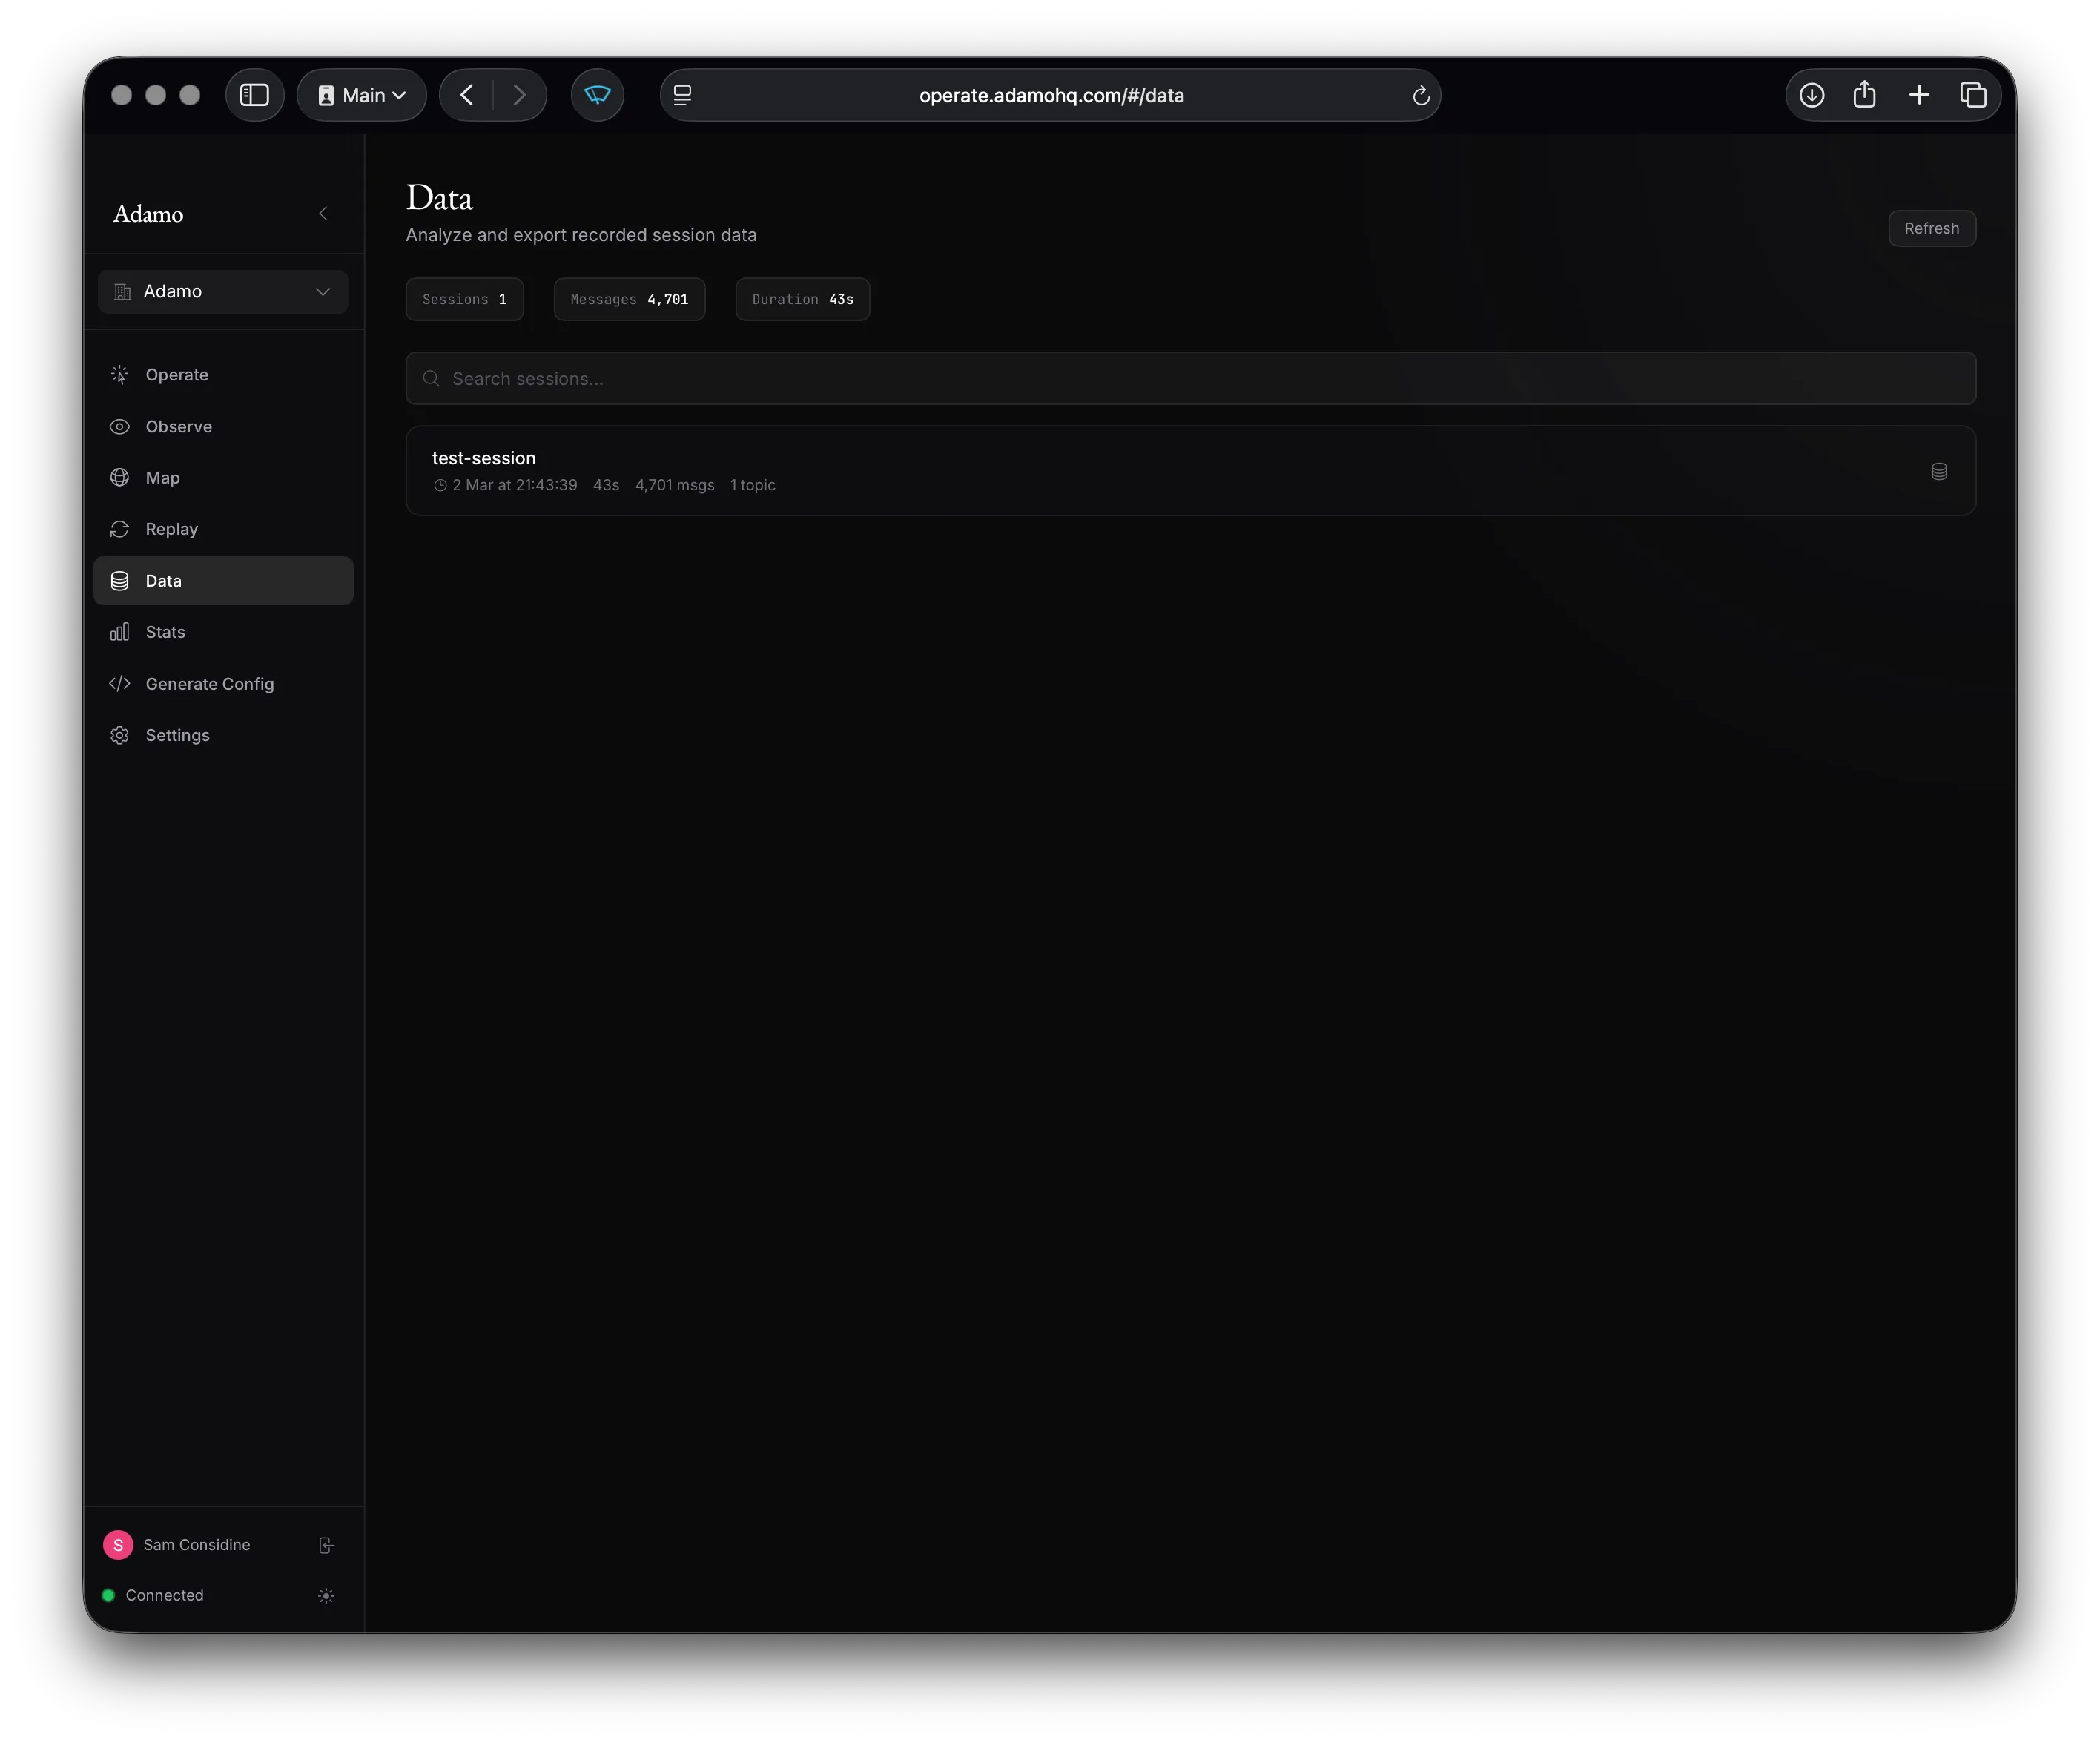
The Data page (/data) lets you explore recorded sessions in detail:
- Topic list — browse recorded topics by category (video, control, sensor)
- Density timeline — visualize message density over time, drag to select a time range
- Data tiles — composable grid of visualizations (video playback, sparklines, message rate, raw message inspector)
- Export — download data as CSV or access it programmatically via curl
The Map page (/map) shows robot locations on a geographic map. Robot markers indicate streaming status. Click a marker to jump to the observe view for that robot.
Fleet Stats
Section titled “Fleet Stats”The Stats page (/stats) shows fleet-wide performance metrics: CPU, memory, latency, temperature, battery, and uptime for each robot. Click a row to expand sparkline charts for each metric over time.
Settings
Section titled “Settings”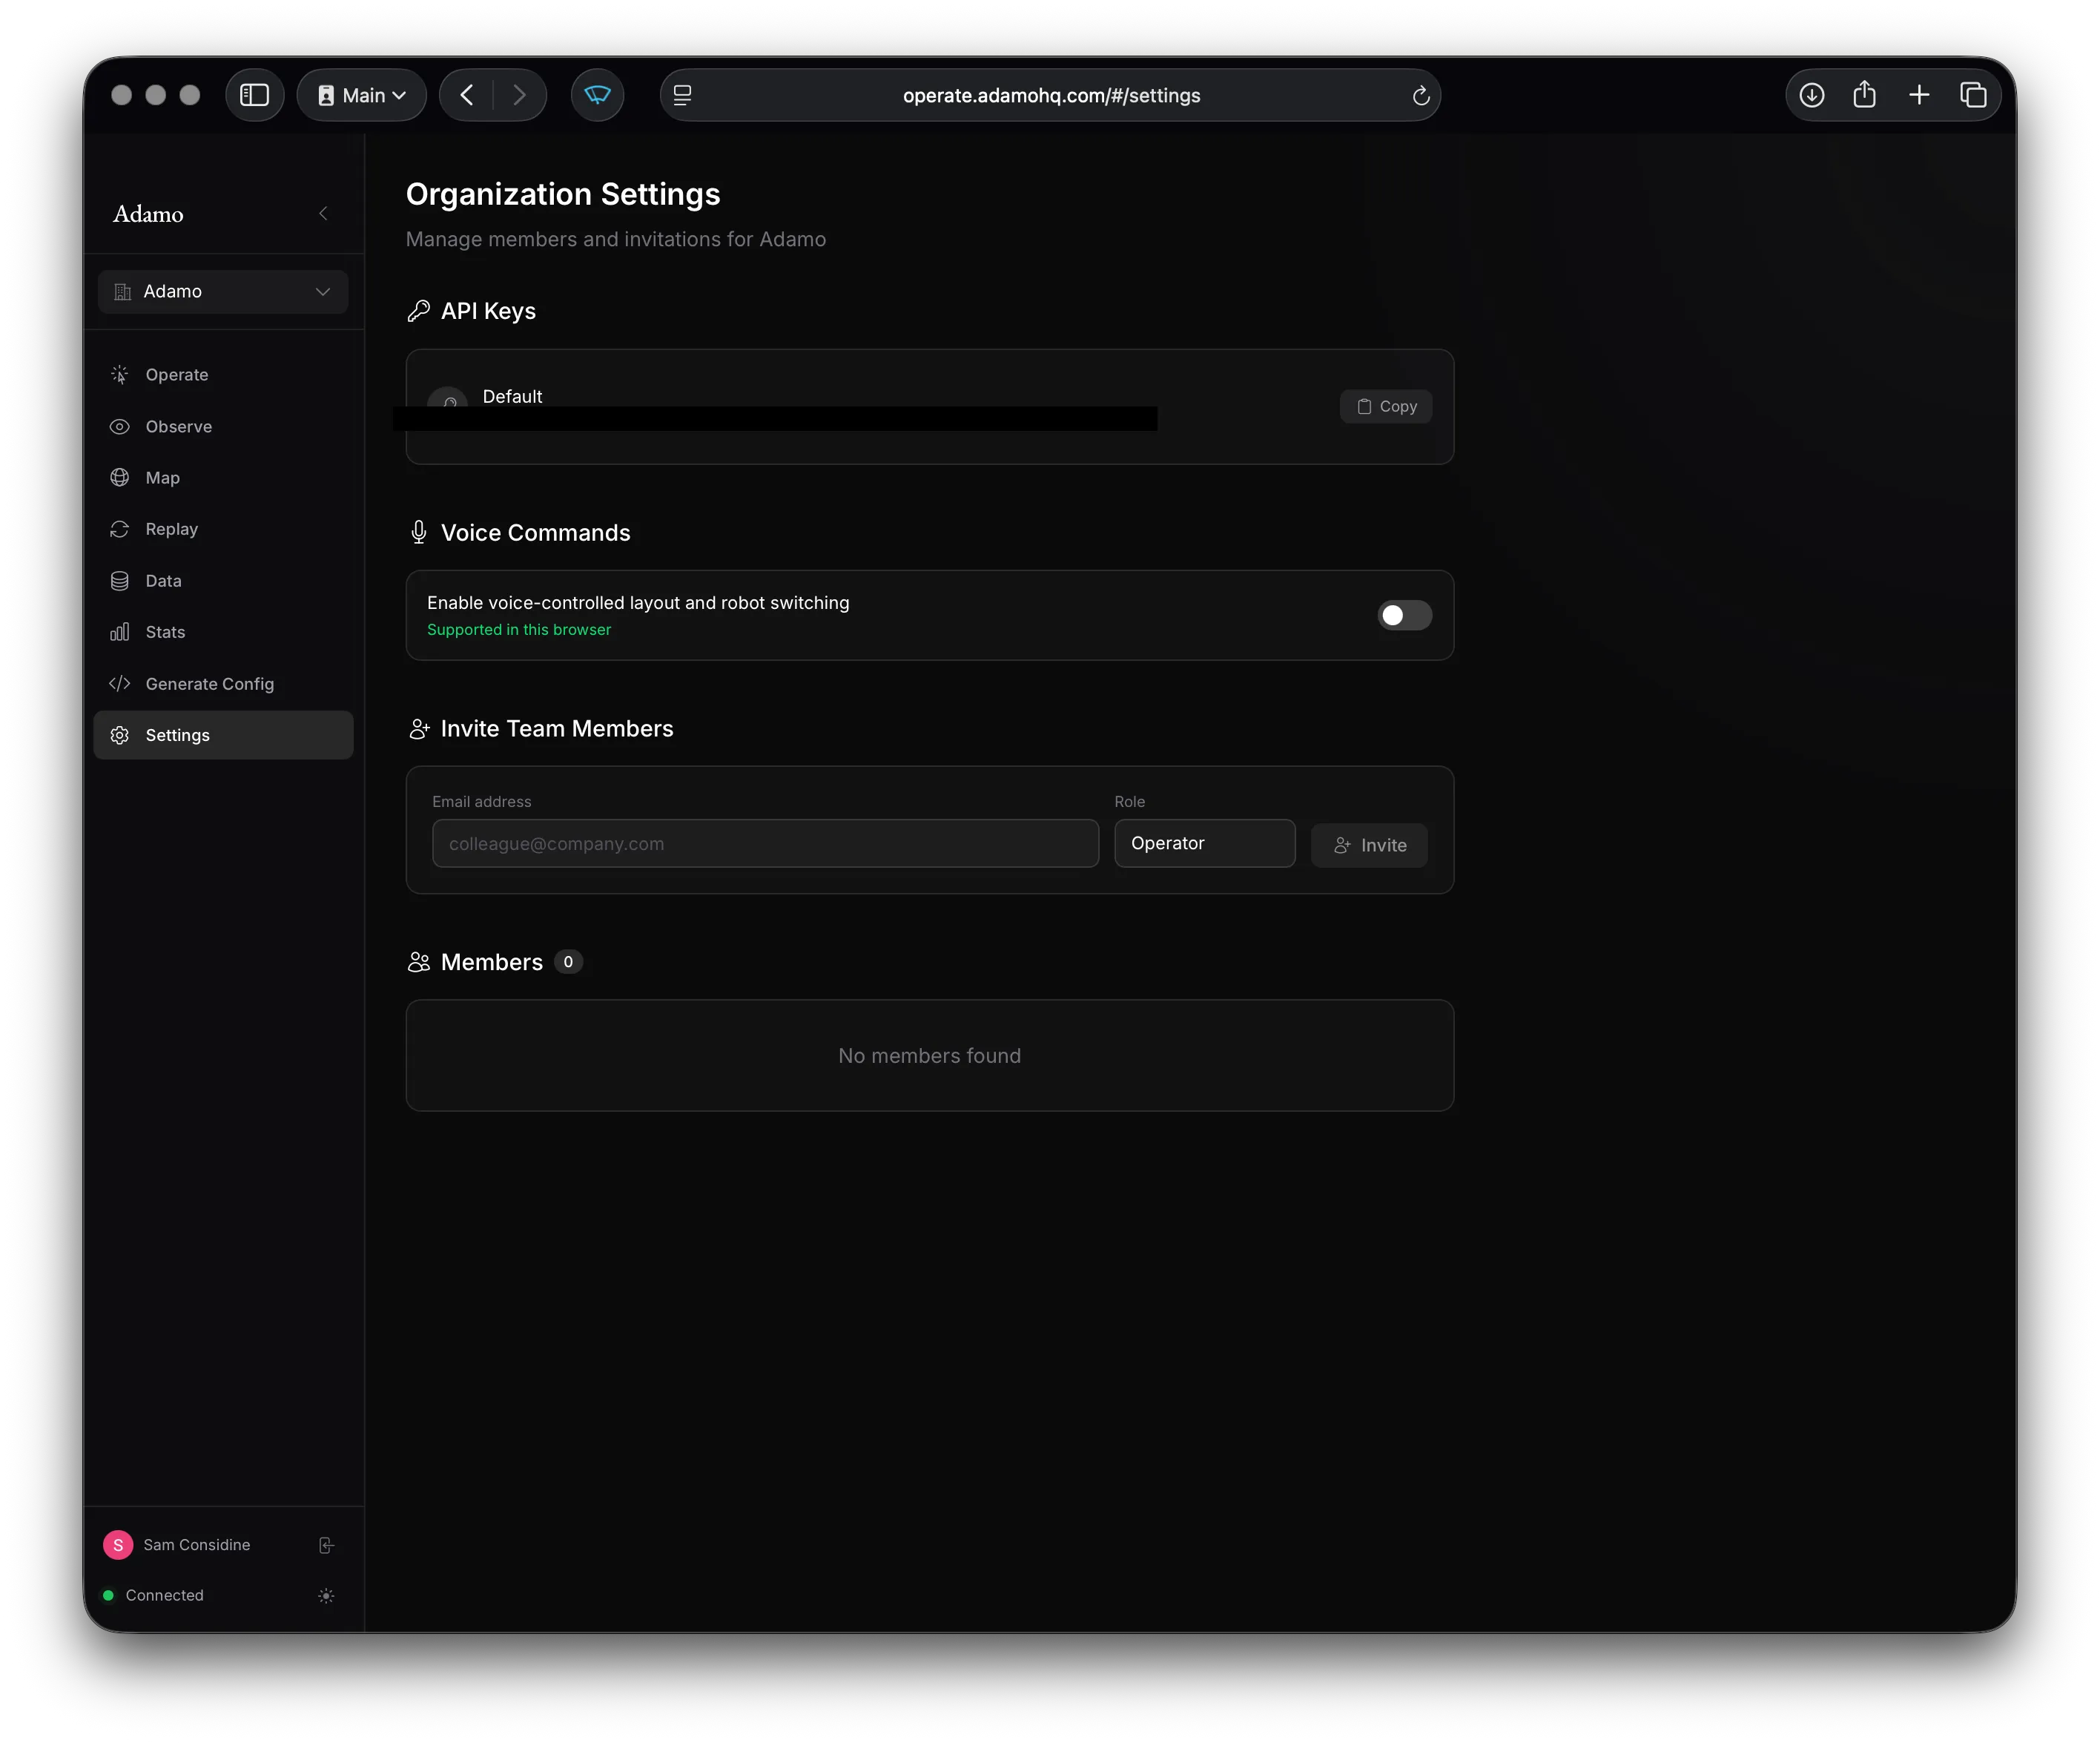
The Settings page includes:
- API Keys — view and copy your organization’s API keys
- Team Members — invite members by email with role assignment (owner, admin, developer, operator)
- Pending Invitations — manage sent invites
- Voice Commands — enable/disable voice control for layout and robot switching